


Why Your Word Document Looks Different on Someone Else's Screen
Your 12-page report opened as 14 on their machine. Here's why, and how to stop it.

28 July 2026
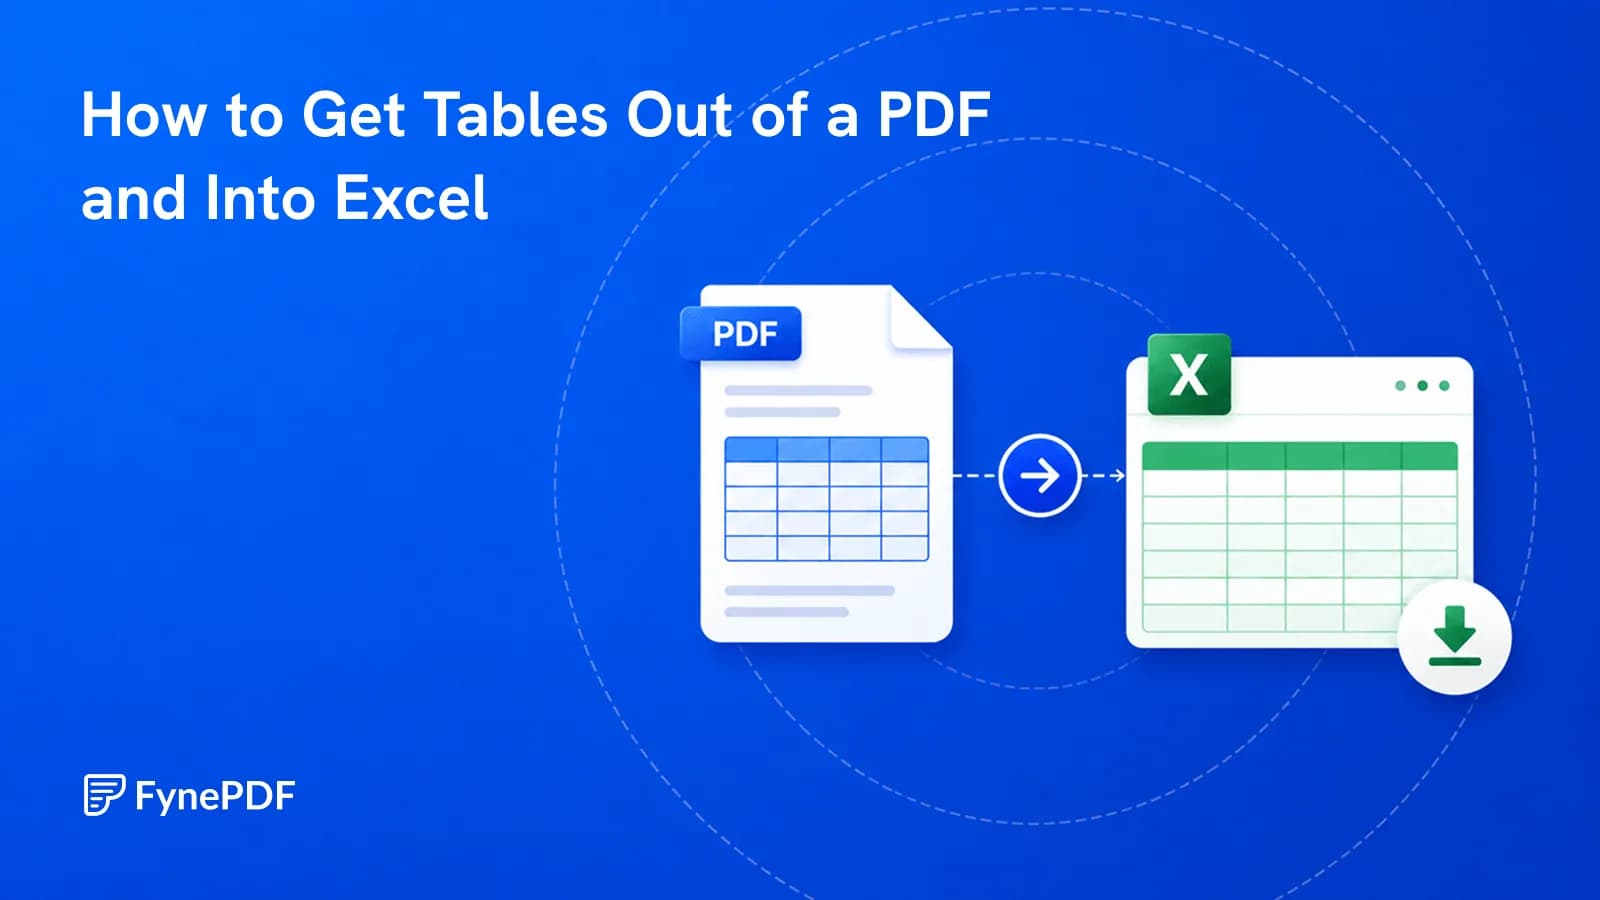
Copy-paste dumps everything into one column. Here's how to get real rows and columns.
Copy-pasting a PDF table into Excel collapses everything into a single column because PDFs store text by position on the page, not by cell. There are no rows or columns in the file to preserve. Converting the PDF properly reconstructs the grid by analysing that positioning and mapping it back into real cells.
Which is why the paste never works, no matter how carefully you select.
A PDF records that a piece of text sits at particular coordinates. It does not record that the text belongs to row 4, column 2 of a table. What looks like a grid to you is visual alignment, nothing more.
When you copy, you get the text in reading order with no structural information, so Excel puts it all in column A. Conversion tools infer the structure from spacing and alignment, which is a genuinely harder problem and why results vary with layout complexity.
That fourth step isn't optional. Always verify a column sum against the figure printed in the original. It catches misaligned rows immediately.
| Table type | Result |
|---|---|
| Ruled grid, clear borders | Reliable |
| Consistent column spacing, no borders | Usually good |
| Merged cells spanning columns | Needs manual repair |
| Multi-line entries within a cell | Rows can split |
| Tables continuing across pages | Headers may repeat mid-data |
| Scanned tables | Requires OCR first |
Bank statements, invoices, and financial reports are usually the well-behaved kind. Nested layouts with merged headers are where you'll spend cleanup time.
Conversion will produce an empty or nearly empty spreadsheet, because there's no text to extract, only an image of one. Run OCR first to add a text layer, then convert.
Verify scanned conversions more carefully than digital ones. OCR misreads on numbers are the dangerous kind: a 1 read as a 7, or a decimal point lost entirely, produces a spreadsheet that looks correct and totals wrong.
Five things, in about two minutes:
If numbers arrive as text, Excel's Text to Columns or a VALUE() pass will convert them.
Long tables reprint their header row on every page, and the converter captures each repetition as a data row. On a forty-page statement that is thirty-nine junk rows scattered through your data.
They are quick to remove once you know they are there. Sort or filter on a column header value and every repeat groups together for deletion in one pass. Do this before any calculation, or your totals will include text rows that silently evaluate to zero.
Tables that continue across a page break can also split a single logical row in two, with the description on one page and the figures on the next. Check the row count against the original before trusting the output.
Extract the relevant pages first with Extract Pages, then convert only those. Faster, and it avoids sifting through dozens of unwanted sheets.
Tables spanning multiple pages reprint their header row on each page, and the converter captures those as data. Sort or filter on a header value to find and delete them in one pass.
Use OCR PDF and export as .txt for plain content without structural reconstruction. It's the better choice for prose and for feeding text into another system.
Files transfer over encrypted connections and are permanently deleted within 15 minutes of processing unless you save them to your library. For bank statements and payroll records, that window is the guarantee that matters.
Upload your file to PDF to Excel and check the totals against the original. Two minutes of verification saves rebuilding a model later.
Try it yourself
Your 12-page report opened as 14 on their machine. Here's why, and how to stop it.
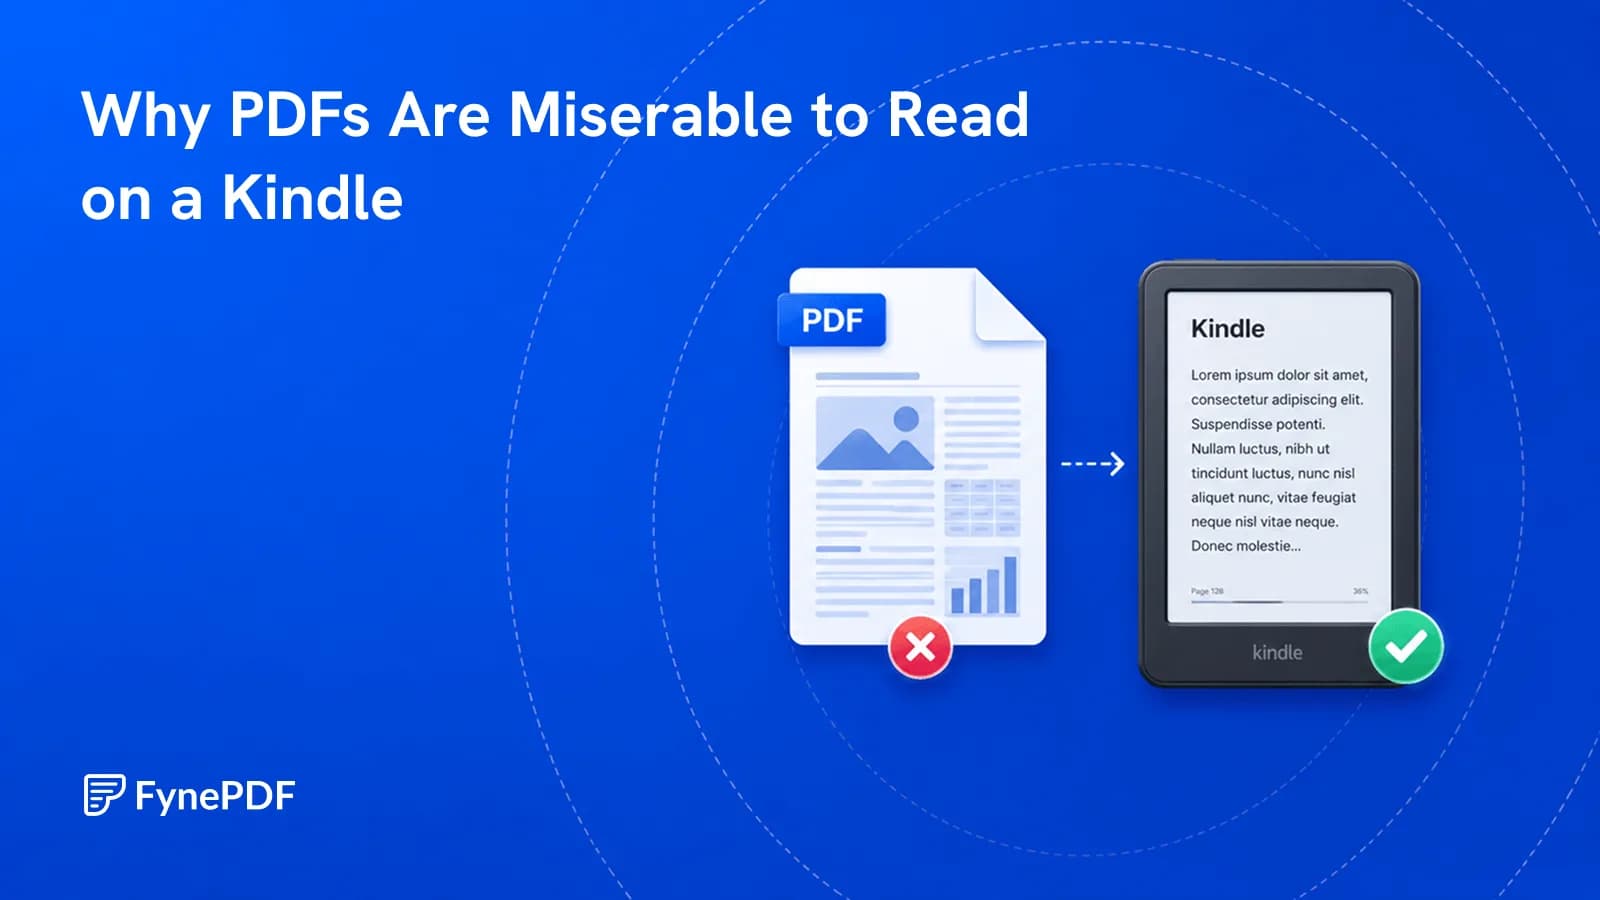
PDFs have fixed pages. E-readers want text that reflows to the screen.
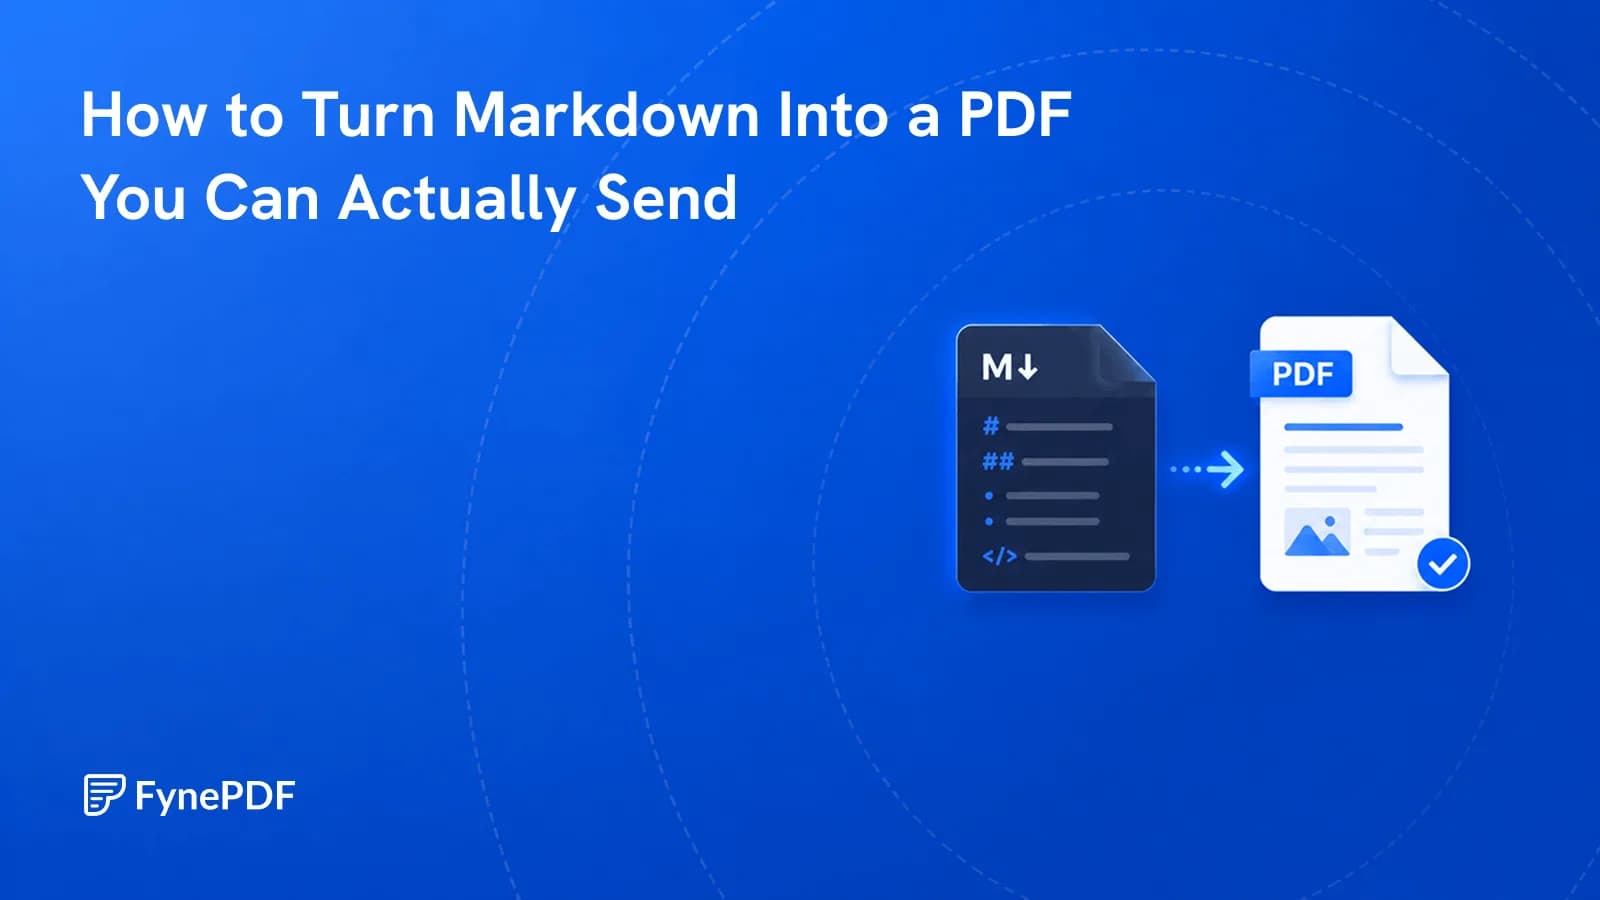
It renders beautifully on GitHub and reads as plain text everywhere else. Convert it.